mysql和其他shell一样,可以自定义终端提示符,这个可能都知道.有3种方法实现

1. 设置系统变量

1
export MYSQL_PS1='\u@\h@\p [\d]'

2. 在my.cnf设置

1
2
[client]  
prompt=\u@\h@\p [\d]>

3. 传prompt参数到mysql 命令行

1
mysql -uroot -pxxxx -h127.0.0.1 --prompt='\u@\h@\p [\d]'

这3种方法在一个机器只有一个mysql 实例的时候都可以适用

问题来了

当一个机器存在2个以上实例,而且有主从关系。我们需要标注我们当前登录的是主库还是从库
当这个需求出现后,如果使用设置系统变量的方法去实现是比较麻烦的.
需要写一些脚本判断当前的库是主库还是从库,然后设置prompt变量

如果用传统的设置在my.cnf的方法,他就是全局的.无法识别登录的是哪个实例

用prompt参数传入mysql命令行明显也不是很好的办法,每次登录要输入一大堆难输入的字符串,还要记住哪个实例是主库或者从库

到这里经过一些联想,发觉,既然mysql有一个机器运行多个实例的mysqld_multi管理工具
他的工作原理就是读取my.cnf里面的section的配置
然后去启动和关闭mysqld进程的,既然他能从用户输入的参数定位到my.cnf里面的section,mysql应该是实现了这个功能的.
经过一番google,确实发现一个不怎么常用的参数’–defaults-group-suffix=’就是实现去读取自定义的section的.

他的原理是这样的:

如果你指定 –defaults-group-suffix=_good

那么他会去my.cnf读取 [mysql_good] section

到这里,我们的实现方法就明朗了:

配置2个section,一个[mysql_master]和[mysql_slave] ,然后登录的时候传suffix参数就可以了

方案如下

在 my.cnf添加:

1
2
3
4
5
6
7
8
[mysql_master]
socket=/tmp/mysql_3306.sock
prompt='\u@\h:\p (\d)-[master] > '

[mysql_slave]

user=root
socket=/tmp/mysql_3307.sock
prompt='\u@\h:\p (\d)-[slave] > '

登录方式

1
2
3
4
5
[root@localhost ~]# mysql -uroot -p --defaults-group-suffix='_slave'
root@localhost:mysql_3307.sock ((none))-[slave] >

[root@localhost ~]# mysql -uroot -p --defaults-group-suffix='_master'
root@localhost:mysql_3306.sock ((none))-[master] >

简化一下,做一个alias

1
2
3
4
5
[root@localhost ~] vim ~/.bashrc
alias mysqlmaster='/usr/bin/mysql -uroot -p --defaults-group-suffix=_master'
alias mysqlslave='/usr/bin/mysql -uroot -p --defaults-group-suffix=_slave'

[root@localhost ~] source ~/.bashrc

参考连接:

https://dev.mysql.com/doc/refman/5.5/en/option-file-options.html
https://www.quora.com/Is-there-a-way-to-save-default-MySQL-connection-parameters-in-a-configuration-file

假设现在你接手一个nginx反向代理.你如何梳理出一个概览,知道目前代理了哪些站点.后端是哪些,有哪些url在nginx做了处理.

整理出一个类似如下的表格
server_names backend location
sitea.com backenda /auth
siteb.com backendb /rpc
sitec.com backendc /x/y/z

简单的办法就是用shell grep一些关键字,然后得出一些初步信息.
但是用shell格式化还有去除一些多余的字符串是比较琐碎的事情.
于是我写了一个简单的python 脚本来做这个.

1
2
3
4
5
6
7
8
9
10
11
12
13
14
15
16
17
18
19
20
21
22
23
24
25
26
27
28
29
30
31
32
33
34
35
36
37
38
39
40
41
42
class Ngx_Conf_Summary(object):

def __init__(self,conf_file_path):
self.r = {}
self.backend = []
self.conf_path = conf_file_path
with open(self.conf_path,'r') as f:
self.conf_text = f.read().strip()
self.backend_pattern = r'upstream +(.+)+ {([^}]*)}'
#self.backend_host_pattern = r'\d{1,3}\.\d{1,3}\.\d{1,3}\.\d{1,3}:\d+|\d{1,3}\.\d{1,3}\.\d{1,3}\.\d{1,3}'
self.backend_host_pattern = r'server+\s+.+[:]\d+|server+\s+[a-z1-9.+\w]+'
self.location_pattern = r'location (.+){'
self.server_name_pattern = r'server_name (.+);'
print "-----parse conf file: %s------"%self.conf_path

def get_server_names(self):
return "".join(re.findall(r'server_name (.+);',self.conf_text)).split()

def get_backend_hosts(self):
backend_list = re.match(self.backend_pattern,self.conf_text).group(2).split(';')
for backend_text in backend_list:
if backend_text.strip().startswith('#') or not backend_text:
pass
else:
backend_host = re.findall(self.backend_host_pattern,backend_text.strip())
backend_host = "".join(backend_host).replace('server ',"")
if backend_host:
self.backend.append(backend_host)
return self.backend

def get_location(self):
return re.findall(r'location (.+){',self.conf_text)

def summary(self):
self.r['file'] = self.conf_path
self.r['server_names'] = self.get_server_names()
self.r['location'] = self.get_location()
self.r['backends'] = self.get_backend_hosts()
return self.r

ngx_conf=Ngx_Conf_Summary('/tmp/2.vhost')
print ngx_conf.summary()
输出是这样的:
1
2
3
MacBook-Pro:~ min$ python ~/pycode/github/gangster/ngx_conf_parse.py
-----parse conf file: /tmp/2.vhost------
{'server_names': ['2012.site.com', '2015.site.com'], 'backends': ['10.0.7.10', 'upstreamhost1', 'upstreamvhost.v2.com', '10.0.7.5:80', '10.0.7.7:8081', '10.0.7.8'], 'location': ['= /50x.html ', '~ /\\.ht ', '~* ^/(busi|Business)/.*\\.(js|css|png|jpg|gif|ico|zip|rar|flv)$ ', '~* ^/.*\\.(js|css|png|jpg|gif)$ ', '/ ', '^~ /do_not_delete/ ', '~ /purge(/.*) ', '/xy '], 'file': '/tmp/2.vhost'}

这样能解析一个文件.但是解析多个也不难了

1
2
3
4
5
6
import glob
import ngx_conf_parse
conf_file_list = glob.glob(r"/usr/local/nginx/conf/*/*.vhost")
for conf in conf_file_list:
ngx_conf_parse(conf)
print ngx_conf_parse.summary()

1
2
3
4
5
6
7
8
9
10
11
12
13
14
15
16
17
18
19
20
21
22
23
24
25
26
27
28
29
30
31
32
33
34
35
from hashlib import sha1
import os,pickle,time
def cache_disk(seconds = 900, cache_folder="/tmp"):
def doCache(f):
def inner_function(*args, **kwargs):
# calculate a cache key based on the decorated method signature
key = sha1(str(f.__module__) + str(f.__name__) + str(args) + str(kwargs)).hexdigest()
filepath = os.path.join(cache_folder, key)

# verify that the cached object exists and is less than $seconds old
if os.path.exists(filepath):
modified = os.path.getmtime(filepath)
age_seconds = time.time() - modified
if age_seconds < seconds:
return pickle.load(open(filepath, "rb"))

# call the decorated function...
result = f(*args, **kwargs)

# ... and save the cached object for next time
pickle.dump(result, open(filepath, "wb"))

return result
return inner_function
return doCache

@cache_disk(seconds = 900, cache_folder="/tmp")
def do_something_time_consuming(n,a):
d = {}
time.sleep(10)
d['name'] = n
d['age'] = int(a)
return d

print do_something_time_consuming(sys.argv[1],sys.argv[2])

let’s test

1
2
3
4
5
6
7
8
9
10
11
12
13
14
15
16
17
18
19
20
21
22
23
MacBook-Pro:~ min$ time python decorator_cache.py wu 21
{'age': 21, 'name': 'wu'}

real 0m10.032s
user 0m0.017s
sys 0m0.009s

MacBook-Pro:~ min$ time python decorator_cache.py wu 21
{'age': 21, 'name': 'wu'}

real 0m0.028s
user 0m0.017s
sys 0m0.009s
MacBook-Pro:~ min$ time python decorator_cache.py wu 21
{'age': 21, 'name': 'wu'}

real 0m0.028s
user 0m0.017s
sys 0m0.009s

MacBook-Pro:~ min$ ls /tmp
33e9d0f6e649a4c1229580fca2b2d9ca3d770731 e92558a7cd5dd5c082f7299486df5516f615c0f0
3412471a14fb9287155358053089a7d66b8d9fa

可以看到第二次传入相同参数的时候发现不再需要等10秒就能得到结果了,直接从file cache取到了结果.
在tmp目录也看到了对应的key生成的MD5文件名的cache文件.
这个装饰器可以适用于缓存比较小的结果集.如果结果集大了,python pickle模块序列化和反序列化一个比较大的对象是比较耗时的.
另外,如果做file based cache 可以把目录设置在 内存里面 比如/dev/shm这种里面.会加速i/o .

original post:http://www.mitchchn.me/2014/os-x-terminal

1.open

1.1 打开一个程序

1
open /Applications/Safari.app

1.2 用默认的编辑器打开一个文件

1
open -e mytext.txt

1.3 用finder打开一个目录(.就是当前目录)

1
open .

1.4 实际上open比较智能,如果你用open打开一个文件他会用系统默认的程序去打开他,等于双击一个文件
比如你打开pdf png 等图片他会自动用系统的preview打开.

另外一个tips 就是如果你在finder中拖动一个文件到terminal里面,会显示这个文件的全路径.

2. pbcopy and pbpaste

pbcopy能把标准输出暂存到内存中,pbpaste把pbcopy存在内存中的内容输出

1
2
3
MacBook-Pro:Documents min$ echo 'my text'|pbcopy
MacBook-Pro:Documents min$ pbpaste
my text
1
2
3
4
5
MacBook-Pro:Documents min$ pbcopy <realserver
MacBook-Pro:Documents min$ pbpaste
#!/bin/bash
# chkconfig: 2345 90 60
......

3. mdfind

mdfind 就是命令行版的spotlight,spotlight能做到的他都能做到.其主要作用就是搜索你想要搜索的一切,包括文件名,文件里面的内容,文件元数据里面的信息等.

mdfind 查找指定查询范围(-onlyin指定只搜索这个目录里面的内容):

1
2
3
4
5
6
7
8
MacBook-Pro:Documents min$ mdfind -onlyin ~/Downloads/ python
/Users/min/Downloads/goagent/proxy.pac
/Users/min/Downloads/Python%E5%AD%A6%E4%B9%A0%E6%89%8B%E5%86%8C%28%E7%AC%AC4%E7%89%88%29.pdf
/Users/min/Downloads/00_0_0_Percona Live 2015/FacebookXDBPerconaLive2015.pdf
/Users/min/Downloads/00_0_0_Percona Live 2015/Instant monitoring.pdf
/Users/min/Downloads/00_0_0_Percona Live 2015/Bootstrapping databases in a single command_ elastic provisioning for the win.pdf
/Users/min/Downloads/00_0_0_Percona Live 2015/Ansible.pdf
......

mdfind之所以能这么快查找是mdutil这个工具在系统里面对所有文件做了一个索引.mdutil -E可以删除之前的数据重建索引.

4. screencapture

screencapture就是截图命令,快捷键就是 cmd + shift + 3 和 cmd + shift + 4

4.1全屏截图,并打开系统的mail app,把图片贴到邮件内容里面

1
screencapture -C -M image.png

4.2全屏截图,并用preview打开

1
screencapture -C -P image.png

4.3 选择截图,并暂存到剪切版.
运行这个命令以后,会弹出一个照相机式的鼠标指针,你可以选择需要截图的窗口,左键选择以后,这张图就存在剪切板里面了,随时可以粘贴了.

1
screencapture -c -W

5. launchctl

launchctl 可以让你已命令行的方式与系统的init系统lauchd交互.用launchctl可以控制机器上的服务的开关以及系统启动的时候服务的状态.等同于目前比较流行的linux上的systemd系统下的systemctl

5.1 查看系统启动了哪些服务

1
2
3
4
5
6
7
MacBook-Pro:Documents min$ launchctl list
PID Status Label
- 0 com.apple.CoreAuthentication.daemon
- 0 com.apple.quicklook
- 0 com.apple.parentalcontrols.check
347 0 com.apple.Finder
......

5.2 launchctl load和unload一个service

1
sudo launchctl load -w /System/Library/LaunchDaemons/org.apache.httpd.plist
1
sudo launchctl unload -w /System/Library/LaunchDaemons/org.apache.httpd.plist

存放系统服务的配置目录有如下:

  • ~/Library/LaunchAgents
  • /Library/LaunchAgents
  • /Library/LaunchDaemons
  • /System/Library/LaunchAgents
  • /System/Library/LaunchDaemons

6. say

say 就是一个把输入的文字转换成音频输出,他支持很多语言.

1
2
MacBook-Pro:Documents min$ say "我是你爸爸"
MacBook-Pro:Documents min$ say "wtf"

读入一个文件,把音频输出成一个文件

1
say -f mynovel.txt -o myaudiobook.aiff

7. diskutil

diskutil就是macosx里面的”磁盘工具”的命令行版本.
可以格式化,分区,合并分区,添加删除磁盘和分区等.
不建议随意使用这个工具,除非你懂你在干什么.

8. brew

确切来说brew 就是macosx下的第三方包管理软件,等同于redhat下的yum 和debian下的apt
安装brew比较简单

1
ruby -e "$(curl -fsSL https://raw.githubusercontent.com/Homebrew/install/master/install)"

安装完了以后使用就更加简单了

1
2
brew install xxx
brew uninstall xxx

original post: http://blog.stackstate.com/the-monitoring-maturity-model-explained

The pace of change is increasing. Component sizes are shrinking. All the while monitoring solutions are bombarding us with log data, metrics, status reports and alerts. It all scales, but we don’t. How do we prevent from drowning in run-time data?

变化的速度原来越快,组件越来越小,与此同时监控解决方案中log data,metrics,status,report还有alters这些东西也一直轰炸我们,他们的规模都在上涨,而我们却没有,我们如何避免被淹没在这些数据中?

A lot of companies are facing the same problem. They have such a huge amount of data, but can’t get a total unified overview. When problems occur in their IT stack, they don’t know where it originates. Was it a change, an overload, an attack or something else? Based on our experience, we created the Monitoring Maturity Model. At which level is your company now?

很多公司都面临同一个问题,他们都有这么多数据,但是无法得到一个完整的概览,当一个问题出现在他们的it环境中,他们不知道哪里是出问题的源头,到底是一次变更,还是负载过高,或者是一次攻击还是其他事情引起的这次故障?根据我们的经验,我们做了一个监控成熟度的模型的评估表,看看你的公司现在处于什么级别?

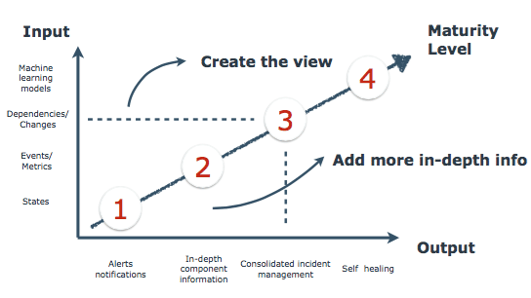
Level 1 - Health of your components

At level one you have different components, but monitor solutions at this level only report if they are up or down. If something happens in your IT stack, you will see a lot of red dots and you will probably get a lot of e-mails which say there is something broken. So at level one you will only see the states and alert notifications per (single) component.

level 1 - 每个被监控组件的健康状态

在1 这个级别,你有不同的被组件,但是你的监控方案只能做到报告这些组件的状态是up 或 down,如果这时候在你的it系统中有一些故障发生,你会看到很多红点警告,还有可能收到很多email,这些email告诉你有些东西坏了.所以在1这个级别你只能看到每个被监控组件的状态,和收到每个被监控组件的报警提醒.

Level 2 - In-depth monitoring on different levels

Most of the companies we’ve seen are at level two of the Monitoring Maturity Model. At this level you are monitoring on different levels and from different angles and sources. Tools like Splunk or Kibana are used for log files analysis. Appdynamics or New Relic are used for Application Performance Monitoring. Finally we have tools like Opsview to see the component’s states of different services. And that’s a good thing, because you need all this kind of data. The more data you have, the more insight you have on the different components. So at this level you are able to get more in-depth insight on the systems your own team is using.

But what if something fails somewhere deep down in your IT stack, which affects your team? Any change or minor failure in your IT landscape can create a domino effect and eventually stop the delivery of core business functions. Your team only sees their part of the total stack. For this problem, we introduce level three of the Monitoring Maturity Model.

级别2 - 不同级别的深入监控

我们见到的大多数公司在监控成熟度模型中都处于2级 这个级别,在这个级别,你会从不同的级别和不同的角度还有不同源头分别做监控,像splunk,kibana这些都用来做日志文件分析, Appdynamics 或者New Relic 这些工具用来做应用的性能监控,最后我们会有类似opsview这种工具来看每个被监控组件的不同的服务的状态.这些都是很好的功能,因为你需要所有的这些类型的数据,你数据越多,你会对不同被监控组件的了解越深.所以在这个级别,你会对你的系统有更多的深入了解.

但是,当一个问题发生在你it系统的特别难发现的地方时候,是否会影响到你的team?任何一个变更或一个小的问题在你的整个it系统中可能会造成一种多米诺骨牌效应,最终影响到你核型业务.你的team只能看到整个架构中属于你们的那一部分.对于这个问题,我们就可以介绍一下级别3了.

Monitoring Maturity Model
img

Level 3 - Create a total overview

At level three we don’t only look at all the states, events and metrics but also look at the dependencies and changes. Therefore you need an overview of your whole IT stack, which will be created using existing data from your available tools. To create this overview you will need data from tools like:

  • Monitoring tools (AppDynamics, New Relic, Splunk, Graylog2)

  • IT Management tools (Puppet, Jenkins, ServiceNow, XL-Deploy)

  • Incident Management tools (Jira, Pagerduty, Topdesk)

Re-use this existing data from different tools to create the total overview of your whole IT stack. At level three you are able to upgrade your entire organization. Now each team can view their team stack as part of the whole IT stack. So teams have a much easier job finding the cause of a failure. Also teams are now able to find each other when this is needed the most. This level also helps the company to get a unified overview while letting teams decide which tools they want/need to use.

级别3 - 做一个完整的概览

在级别3这个阶段,我们不不仅要看所有的stats,event,metrics,而且还要看每个被监控对象的依赖对象以及每个东西的变更.所以你需要有一个利用你现在所有数据和工具做出来的整个架构的概览.要做这个概览你需要类似这些类型的数据和工具

  • 监控工具(ppDynamics, New Relic, Splunk, Graylog2)
  • it 管理工具(Puppet, Jenkins, ServiceNow, XL-Deploy)
  • 事件管理工具(Jira, Pagerduty, Topdesk)

重用这些以有工具生成的已有数据去生存一个整个系统的完整概览.在级别3,你能升级你的整个组织结构了.现在每个team能以全局的视角看到每个team自己的那一部分.现在这些team能在出问题的时候更容易找到问题发生的原因.而且现在这些team也可以在需要的时候找别的team.让每个team决定他们自己自己需要用活着想用的工具能帮助公司得到一个完整统一的系统概览.

Level 4 - Automated operations

Level four is part of our bigger vision, at this level we will be able to:
Send alerts before there is a failure
Self-heal by for example scaling up or rerouting services before a service is overloaded
Abnormality detection
Advanced signal processing

级别4 - 自动化操作

级别4是我们大前景的的一部分,在这个级别,我们可以:
在发生故障之前发送报警
自动修复,在负载过高的时候,自动扩展或者动态重新路由.
异常行为检测
高级信号处理